SP500 Just Logged Its 5th Biggest 2-Day Drop In 75 Years
Apr 12, 2025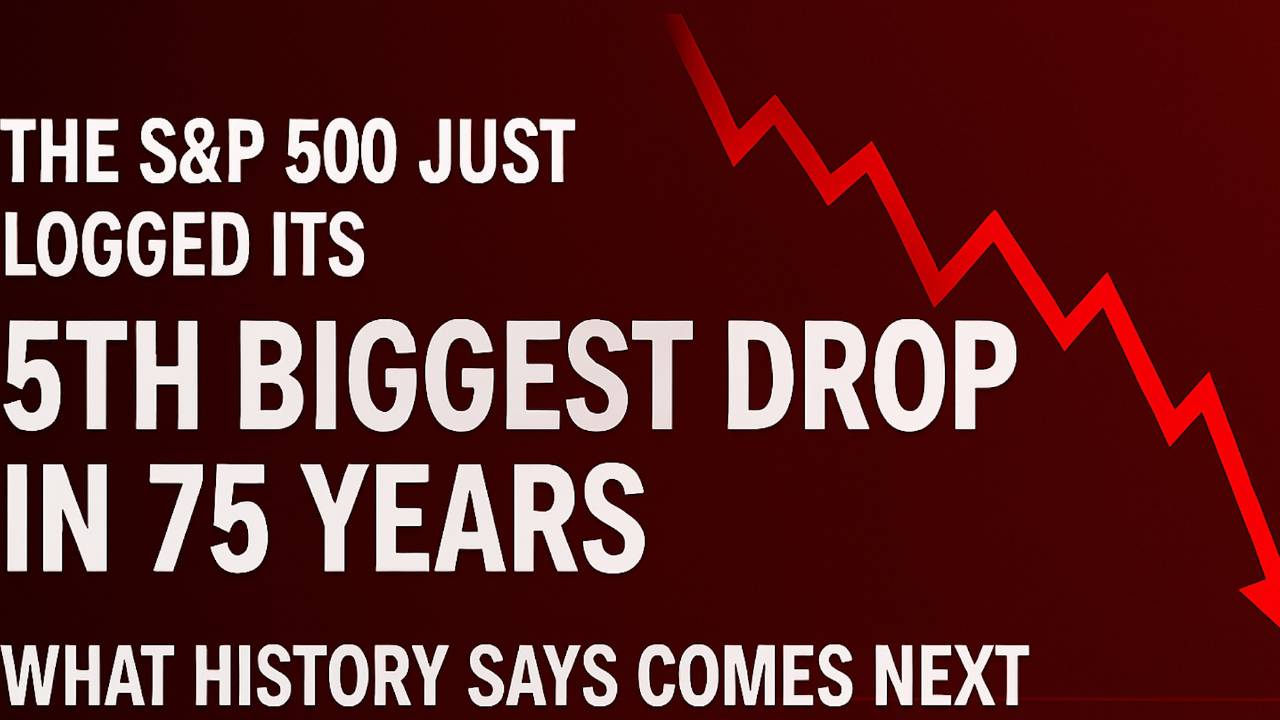
The S&P 500 Just Logged Its 5th Biggest 2-Day Drop in 75 Years — Here’s What History Says Comes Next
For over two years, the market marched forward in one of the most powerful bull runs in recent memory. The charge was led by artificial intelligence, strong economic resilience, and major stock splits in large-cap leaders. That momentum helped lift the Dow Jones, Nasdaq, and S&P 500 to all-time highs.
But as seasoned investors know, no market moves in a straight line. On April 3 and 4, the S&P 500 fell a combined 10.5%, marking the fifth-largest two-day decline since 1950.
This sharp drop has investors on edge—and many are turning to historical data to find clarity. Some of the biggest swings have been in the last 20 years comparative to the history of the stock market. Large swings have just become the norm. While nothing can predict the future with certainty, history does offer guidance in times like these.
Why Did the Market Crash?
Let’s first address what triggered this pullback.
A major catalyst was the recent announcement of a sweeping global tariff policy from President Trump. Dubbed “Liberation Day,” the policy introduces a 10% global tariff and additional reciprocal tariffs on nations with longstanding trade imbalances with the U.S.
The objective: boost U.S. revenue, protect domestic jobs, and bring manufacturing back to American soil.
However, tariffs come with risks. Particularly concerning is the lack of separation between input tariffs—taxes on raw materials used in U.S. production—and output tariffs—taxes on finished imported goods. The former can drive inflation higher during a time of already slowing growth, complicating an already delicate economic landscape.
But it wasn’t just tariffs rattling the market.
The broader market had become stretched. The S&P 500’s Shiller P/E ratio (also called the CAPE ratio) peaked at 38.89 in December 2024—more than double the historical average of 17.23 going back to 1871. This marked only the sixth time in 154 years the ratio held above 30 for two or more months. In each of those prior instances, the market followed with corrections ranging from 20% to as much as 89%.
In simple terms: investors finally pushed back on inflated valuations.
Here’s the Good News: Historically, Declines Like This Are Long-Term Buying Opportunities
When fear is high, it’s easy to forget what history shows us. But let’s zoom out.
Looking at the 10 biggest two-day declines in the S&P 500 since 1950, every one of them was followed by strong returns over the long haul.
Following past drops of 9% or more in just two days, the average returns were:
- +31.8% after 1 year
- +50.2% after 3 years
- +121.9% after 5 years
For perspective, the average annual return of the S&P 500 from 1957 through 2023 is around 10.5%. These crash-level events have consistently laid the foundation for outsize long-term gains.
Time in the Market Still Beats Timing the Market
Research into rolling 20-year total returns of the S&P 500 (spanning 1900 to 2024) reveals something remarkable: Every single 20-year window showed a positive return.
That includes holding through recessions, wars, pandemics, and market crashes. Investors who stayed the course and remained disciplined were rewarded 100% of the time.
The message is simple: the current market environment, as painful as it may feel in the short term, has historically been one of the best times to put long-term capital to work.
What We Tell Our Members at Catalyst Wealth Coaching
We don’t believe in panic. We believe in preparation.
When volatility strikes, our job is to provide clarity and strategy—whether that’s rotating from equities to fixed income, protecting downside with tools like Portfolio Insurance™, or using proprietary setups from our trading systems.
Corrections are not curses. They’re the market’s way of restoring balance.
If you're wondering what to do next—don’t go it alone. Use data, lean on DATA DRIVEN systems like Advisor's Edge, and surround yourself with professionals who are actively reading the market’s language every day (OUR WEEKLY MASTERMIND)
At Catalyst Wealth Coaching, that’s exactly what we help you do.