
The Yen Carry Trade and Junk-Bond Credit
Sep 03, 2026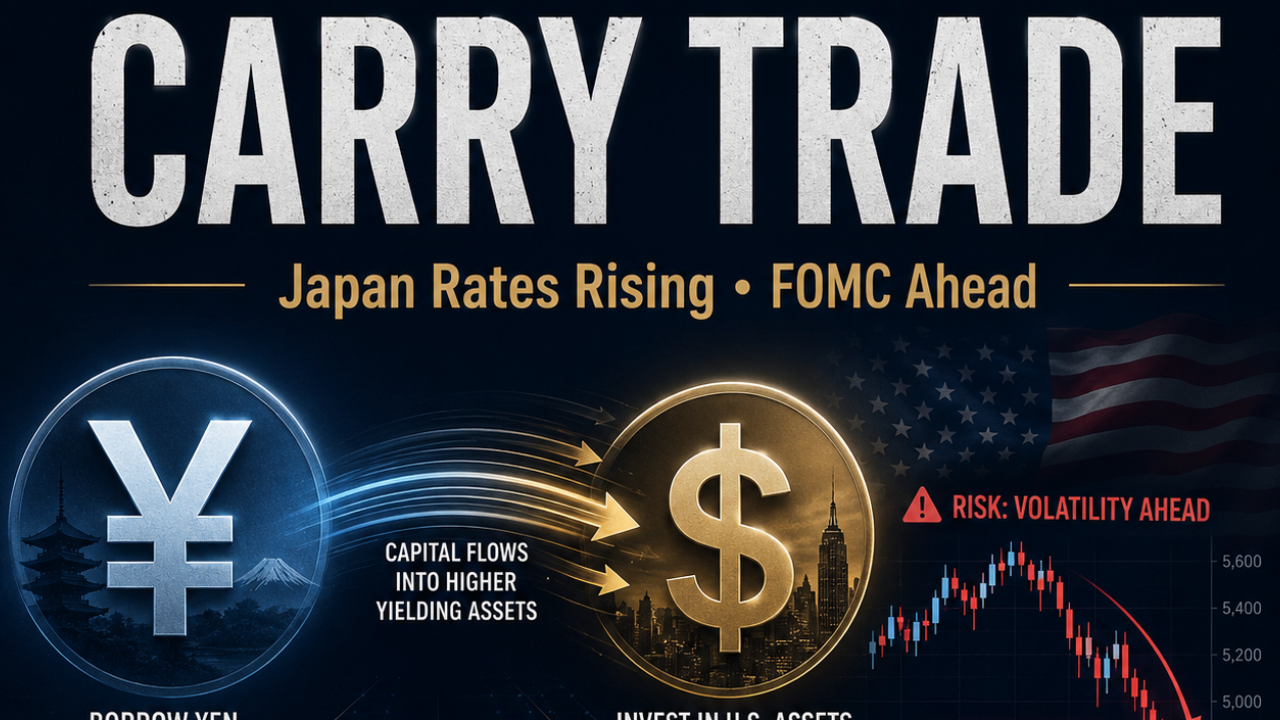
The stock market may look strong on the surface, but two important forces are developing underneath it: rising Japanese interest rates and growing stress in the lowest-quality corner of the U.S. credit market.
Neither guarantees an immediate stock-market decline. However, together they tell investors that the market is becoming more fragile and that liquidity, borrowing costs, and credit conditions deserve close attention.
The Yen Carry Trade
For decades, Japan maintained some of the lowest interest rates in the world. That allowed large investors, hedge funds, institutions, and trading firms to borrow Japanese yen cheaply and invest that money in higher-returning assets elsewhere.
The basic trade looked like this:
-
Borrow yen at a very low interest rate.
-
Convert the yen into U.S. dollars or another currency.
-
Invest the money in U.S. stocks, Treasury bonds, corporate debt, technology companies, or other risk assets.
-
Earn the difference between the low Japanese borrowing cost and the higher return on the investment.
This is known as the yen carry trade.
The strategy works well while Japanese interest rates remain low, the yen remains weak or stable, and global asset prices continue rising.
The risk appears when that environment begins to reverse.
Why Japanese Interest Rates Matter
Japanese rates and government-bond yields have risen sharply. As of September 3, Japan’s 10-year government-bond yield was approximately 2.97%, while the 30-year yield was approximately 4.08%. The Bank of Japan’s deposit-facility rate is currently 1%, and its next monetary-policy meeting is scheduled for September 17–18. Bank of Japan, Japan 10-year yield, Japan 30-year yield
The 30-year Japanese yield moving above 4% does not mean the Bank of Japan’s short-term policy rate is 4%. It means investors are demanding more than 4% to own Japan’s long-term government debt. That reflects concerns about inflation, government borrowing, fiscal conditions, and the future direction of monetary policy.
This matters because higher Japanese rates begin to remove the primary advantage behind the carry trade.
If investors can earn more money inside Japan, they may become less willing to borrow yen and move that capital overseas. Japanese institutions may also begin selling foreign assets and bringing money home.
How the Carry Trade Unwinds
A yen carry-trade unwind can create a chain reaction:
-
Investors sell U.S. stocks, bonds, or other assets.
-
They convert the proceeds back into yen.
-
Yen buying causes the currency to strengthen.
-
A stronger yen increases the cost of repaying yen-denominated loans.
-
That forces more investors to reduce leveraged positions.
-
Additional selling can create volatility across global markets.
This is why the yen is so important. The danger is not simply that Japanese rates are rising. The greater danger is a rapid combination of higher Japanese rates, a stronger yen, and forced deleveraging.
The yen recently strengthened more than 2% as expectations increased that the Bank of Japan may raise rates again. Markets were pricing a significant probability of a September rate increase. Reuters
A gradual adjustment can be absorbed by markets. A disorderly unwind can force investors to sell profitable positions simply to reduce leverage and repay yen loans. In that situation, even fundamentally strong investments can temporarily decline.
The Difference Between Junk-Bond Prices and Junk-Bond Spreads
Another important source of information comes from the high-yield—or “junk”—bond market.
Investors must distinguish between junk-bond prices and junk-bond spreads because they normally communicate risk in opposite directions.
Junk-bond prices
Junk-bond prices represent what investors are willing to pay for below-investment-grade corporate debt.
Because junk bonds carry substantial business and default risk, their prices generally behave more like stocks than high-quality government bonds.
When investors are confident:
-
Stock prices generally rise.
-
Junk-bond prices generally rise.
-
Investors are willing to accept more risk.
When investors become defensive:
-
Stock prices may fall.
-
Junk-bond prices may fall.
-
Investors demand greater compensation for risk.
Therefore, junk-bond prices and the S&P 500 normally move in the same general direction.
Junk-bond spreads
A credit spread measures the additional yield investors demand to own a corporate bond instead of a comparable Treasury security.
For example, if a Treasury bond yields 5% and a CCC-rated bond yields 15%, the credit spread is approximately 10 percentage points, or 1,000 basis points.
That additional yield compensates investors for:
-
Default risk
-
Liquidity risk
-
Economic uncertainty
-
Refinancing risk
-
Potential loss of principal
When spreads fall, investors are demanding less compensation for risk. That normally indicates improving confidence.
When spreads rise, investors are demanding greater compensation. That normally indicates increasing concern.
This means junk-bond spreads generally move inversely to the S&P 500.
How to Read the Confirmations and Divergences
Comparing the S&P 500 with junk-bond prices
-
S&P 500 rising and junk-bond prices rising: Bullish confirmation. Equity and credit investors are both accepting risk.
-
S&P 500 falling and junk-bond prices falling: Bearish confirmation. Investors are reducing risk across both markets.
-
S&P 500 rising while junk-bond prices fall: Bearish divergence. Credit investors may be detecting stress that equity investors have not recognized.
-
S&P 500 falling while junk-bond prices rise: Potential bullish divergence. Credit conditions may be stabilizing before stocks recover.
Comparing the S&P 500 with junk-bond spreads
-
S&P 500 rising while spreads fall: Bullish confirmation. Stocks are advancing while perceived credit risk declines.
-
S&P 500 rising while spreads rise: Bearish divergence. Stocks remain optimistic while credit investors demand more protection.
-
S&P 500 falling while spreads rise: Bearish confirmation. Both markets indicate increasing risk.
-
S&P 500 falling while spreads fall: Potential bullish divergence. Credit conditions may be improving ahead of equities.
The easiest way to remember the relationship is:
Junk-bond prices should generally move with the S&P 500. Junk-bond spreads should generally move opposite the S&P 500.
Two lines moving in opposite directions do not automatically represent a meaningful market divergence. When comparing stock prices with credit spreads, opposite movement is normally expected. A true warning occurs when the expected relationship breaks down.
What Is Happening Now?
The current picture has changed and deserves attention.
The S&P 500 remains close to historically high levels and was approximately 18.5% higher than one year earlier as of September 3. The index has continued showing resilience despite pressure from oil, interest rates, and geopolitical uncertainty. S&P Dow Jones Indices, Reuters
However, the lowest-quality part of the credit market is beginning to communicate greater concern.
The ICE BofA CCC and Lower U.S. High Yield Option-Adjusted Spread increased from 10.26% on August 28 to 10.53% on September 2. It was also substantially higher than its 7.98% reading from one year earlier. Federal Reserve Bank of St. Louis
That is a meaningful change.
If the S&P 500 remains elevated or continues rising while CCC spreads are also rising, the relationship becomes a bearish credit divergence. Equity investors are maintaining an optimistic outlook, but investors in the riskiest corporate debt are demanding considerably more compensation for potential default and liquidity risk.
The warning is especially notable because the broader high-yield market is not displaying the same degree of stress. The overall U.S. high-yield spread was approximately 2.66% on September 2, compared with the CCC spread of 10.53%. Federal Reserve Bank of St. Louis
That suggests the pressure is currently concentrated in the weakest companies rather than spread evenly across the entire corporate-credit market.
This does not automatically mean a recession or major stock-market decline is imminent. CCC indexes can be affected by a smaller group of distressed issuers, and high-yield bond prices can also be influenced by Treasury yields, duration, distributions, and fund flows. The HYG exchange-traded fund, for example, had an effective duration of approximately three years and an option-adjusted spread near 240 basis points as of September 2. BlackRock
Nevertheless, rising CCC spreads should not be ignored when the S&P 500 remains near its highs.
Why These Two Developments Matter Together
The yen carry trade and CCC credit spreads measure different parts of the financial system, but they are connected through liquidity and risk appetite.
The yen carry trade tells us about:
-
Global leverage
-
Currency risk
-
International liquidity
-
The cost of financing speculative positions
CCC spreads tell us about:
-
Corporate default risk
-
Refinancing pressure
-
Credit-market liquidity
-
Investors’ willingness to finance vulnerable businesses
When Japanese rates rise, the yen strengthens, and CCC spreads widen at the same time, the financial system is sending a message that money is becoming more expensive and investors are becoming more selective.
Meanwhile, the S&P 500 may remain strong because it is heavily influenced by a relatively small group of large, profitable companies. That can create a market in which the headline index appears healthy while weaker companies and lower-quality borrowers experience mounting pressure underneath the surface.
What Should Investors Watch Next?
Investors should not treat one indicator as an automatic buy or sell signal. The better approach is to watch whether several independent markets begin confirming the same message.
Important indicators include:
-
Whether CCC spreads continue rising or begin falling again
-
Whether broader high-yield spreads follow CCC spreads higher
-
Whether HYG and JNK prices confirm the S&P 500
-
Whether the yen continues strengthening against the dollar
-
Whether Japanese yields continue rising
-
Whether the Bank of Japan raises rates again
-
Whether the Federal Reserve holds or raises U.S. rates
-
Whether S&P 500 market breadth weakens
-
Whether small-cap stocks and financially sensitive sectors begin underperforming
-
Whether volatility and funding stress increase
The strongest warning would be a combination of a strengthening yen, widening credit spreads, falling junk-bond prices, weakening market breadth, and an S&P 500 that continues holding near its highs. That would indicate that liquidity and credit conditions are deteriorating before the headline index fully reflects the risk.
The Bottom Line
The S&P 500 is still showing strength, but the financial system is beginning to flash caution beneath the surface.
Rising Japanese yields threaten the economics of the yen carry trade and create the possibility of global deleveraging. At the same time, widening CCC credit spreads indicate that investors are demanding substantially more compensation to finance the most vulnerable U.S. companies.
Neither development guarantees a market correction. However, together they suggest the market may be moving from a broad, comfortable risk-on environment toward a more selective and fragile one.
For investors, the message is not necessarily to abandon the market. The message is to remain aligned with the primary trend while paying closer attention to liquidity, credit conditions, market breadth, position sizing, and risk management.
The S&P 500 tells us what stock investors are doing. The yen tells us what may be happening to global liquidity. Junk-bond prices tell us whether credit investors are participating in the risk-on move. Credit spreads tell us how much fear is building underneath it.
When all four agree, the market’s message is powerful.
When they stop agreeing, investors should pay attention.
This material is provided for educational purposes only and should not be considered financial, investment, tax, or legal advice. Investing involves risk, including the possible loss of principal.