Heavy at the Top
Oct 01, 2026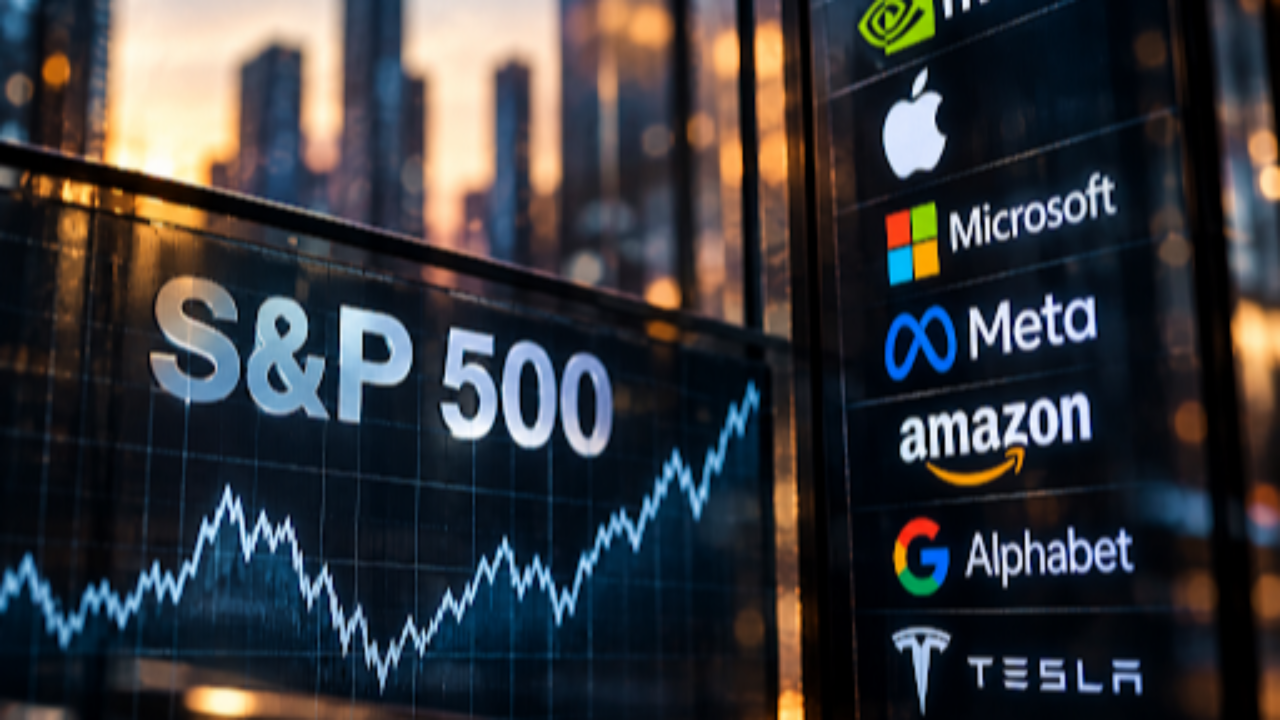
If you only glanced at the S&P 500 heading into October, you’d probably wonder what everybody is fussing about. September—the month Wall Street loves to warn us about—finished basically flat. The index is still hanging around its highs. Earnings are holding up. Nothing to see here, right? Ehhh. We might want to look under the hood, because while the S&P 500 was busy looking perfectly presentable for company, roughly 75% of the stocks inside it finished September lower.
The breadth numbers get even more interesting. Only about 40% of S&P 500 stocks are still trading above their 200-day moving average, down from roughly 73% in August. Shorten the lens to the 50-day and we’re down around 25%. That’s not a little wobble. That’s a whole lot of stocks quietly slipping out the back door while the index keeps smiling for the family photo. A healthy advance usually brings more stocks along for the ride, and right now, that guest list is getting noticeably shorter.
So how is the S&P still holding up so well? Meet the world’s most overworked group project. The top 10 stocks now make up close to 40% of the entire S&P 500, a level of concentration we haven’t seen in decades. Nvidia, Apple, Microsoft, Meta and the rest of the mega-cap crew have gotten so big that they can make the whole market look healthier than the average stock actually is. September made the point beautifully: the traditional S&P 500 barely moved, while the equal-weight version—where every company gets the same vote—fell more than 4%. Same 500 companies, very different picture.
Now, before anybody starts ordering canned goods and building a bunker, weakening breadth does not mean the bull market is over. There are some legitimate arguments on the other side. Corporate earnings remain strong, investor sentiment certainly doesn’t look euphoric, and October historically carries one of the better seasonal records on the calendar. Breadth can recover quickly, too—we’ve already watched it do exactly that this year. But none of that makes these numbers irrelevant. It simply means we don’t have to turn every warning light into a five-alarm fire.
What we do have is a market telling us two stories at the same time. The headline index says, Relax, we’re fine. Underneath it, most stocks are saying, Umm...define fine. And this is exactly why watching an index number isn’t enough. Price tells us where the market is. Breadth tells us how many stocks actually helped get it there. When fewer and fewer companies are doing more and more of the lifting, we want to know that—not because it tells us exactly what happens next, but because it tells us something underneath the surface has changed.
We don’t need to call the top, declare AI a bubble, or decide October is destined for either a crash or a rip-your-face-off rally. We just need to read what’s actually in front of us. Right now, the S&P 500 still looks pretty darn good from 30,000 feet, but down on the ground, the crowd has thinned considerably. And those few stocks carrying everybody else’s luggage?
We’re keeping an eye on the baggage claim.